


What is downside risk?
And more importantly, how is it useful?

In Financial management and portfolio theory, standard deviation (i.e., the square root of the variance) is the most used measure of volatility and risk. Of course, other measures of relative risk exist, such as beta and correlation between assets. However, in this post, I will explain the variance and semi-variance of a given security and provide some comparative statistics to see the benefits (or maybe not!) of using each measure of risk.
Part 1: Risky Business
Usually, when measuring the volatility of a stock, we assume that a given stock is a random variable. (it also can be considered as a stochastic process, but that is for another day)
Then, the volatility of such a stock is measured by
This empirically can be measured using the closing prices of a given stock. So, if we consider the closing price of Apple, volatility essentially measures how much the cost of Apple shares deviates from its average. Variance is used as a measure of volatility because it intuitively shows us the price fluctuations. But this is where semi-variance seems to be a better choice. If the price of Apple stocks goes up, can that be considered risky? Most of us would argue not.
So, what is semi-variance? It is essentially a measure of downside risk. We modify the definition of variance where we only consider downward fluctuations of prices as a risk. It is defined as the following scary-looking equation:
But all this means is how much a stock's price goes downward. Now that we know this, let’s look at it more deeply.
Part 2: How is semi-variance different?
This section is purely hypothetical and simulated. Feel free to skip it if you wish to jump directly to empirical settings. With that said, let’s dive right in.
Suppose Apple stocks follow a normal distribution (IT’S NOT!! But let’s take this hypothetical case anyway)
Here, Apple’s stock prices fluctuate by some amount. The following statement is a bit technical, but take my word for it: If a price is normally distributed, its volatility is Chi-Square distributed, i.e.,
So, with that in mind, how do you think semi-variance differs in measuring risk? To understand, I conducted a Monte-Carlo simulation, which gave me a good understanding of how it differs. The following graph is the result of the simulation:
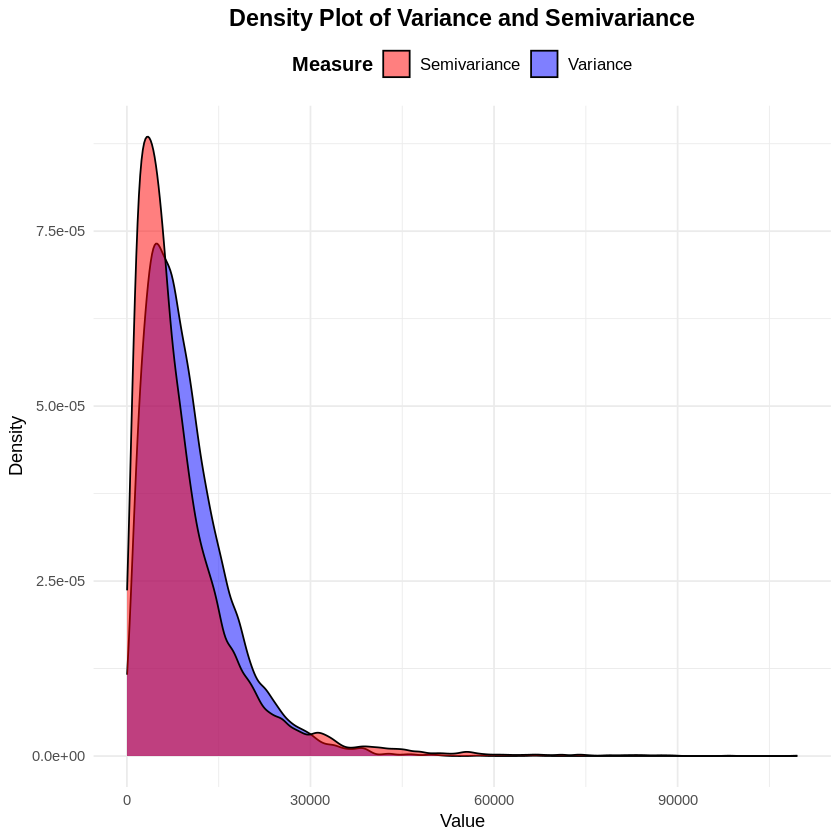
As shown in the above density curves, semi-variance is skewed slightly more than variance, indicating lower risk simply because it does not consider upside price movements. The estimate of semi-variance is downward-biased compared to the variance. Additionally, it does not vary as much as variance due to its more stable nature. But how does this translate into optimising a portfolio? Does performance increase or decrease? What kind of stocks does it prefer? That is precisely what we will look at in the next section.
Part 3: Does it optimise better?
When performing portfolio optimisation to minimise risk on the magnificent 7 (namely Microsoft, Amazon, Meta, Apple, Google, Nvidia, and Tesla) with standard deviation and semi-standard deviation as risk measures, we can see the following plot, which shows that semi-standard deviation portfolios prefer equities with lower upside risk more compared to volatility as a whole.

What about maximising the Sharpe Ratio? The following plot shows that when wanting to have the best risk-return trade-off, the standard deviation is comparatively more conservative than the semi-standard deviation. Consider Nvidia, especially. Recently, it has been quite volatile, but when considering downside risk, it is relatively lower than general volatility, which is reflected in the higher weight for Nvidia.

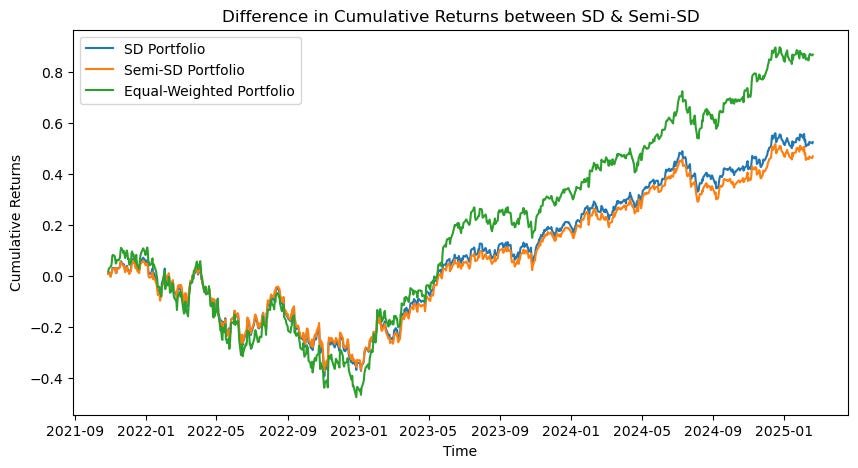
Now that we know the composition of our SD and semi-SD portfolios let’s examine their cumulative returns over a 5-year horizon. Post-COVID-19, we can see a divergence among all portfolios. The semi-SD portfolios outperform the SD and equal-weighted portfolios!

Note: The above cumulative returns are a product of maximising the Sharpe Ratio.
What if we want to minimise the risk of the whole portfolio? It is also known that equal-weighted portfolios outperform any minimised-risk portfolio. Let’s see how the minimum risk portfolios are fair.
As expected, the equal-weighted portfolio outperforms the minimum-risk portfolios as they come with a higher risk (and usually, in a perfect market, higher risk is associated with higher return as compensation for the risk undertaken). What is more interesting is that only protecting yourself against downside risk (semi-SD portfolio) yields lower returns than general risk (SD portfolio). A plausible explanation is that we have lower “risk as a whole” in the semi-SD portfolio compared to the SD portfolio. So, an investor is compensated less but not by too much.
Conclusion:
So, is semi-SD better? Not exactly. It depends a lot more on what you intend to do with it. If you have a higher risk appetite and wish to maximise your risk-return trade-off, you might want to use this as a measure. However, the fundamental flaw remains that past returns do not indicate the future. Additionally, just optimising a portfolio solely on past pricing data is more like gambling than anything else. So, we can look forward to more complicated machine-learning or reinforcement learning-based models which can adapt to a more dynamic environment. Or, of course, we can also go old school to find opportunities for asymmetric returns, which is tedious, in my opinion.
Note: No content in this blog post is financial advice, and any risk involved with financial markets is solely the responsibility of the investing party,
Comment if you want to learn how I implemented all the code or any other specific topic!